Israel's 2026 Knesset election: what the public ballot-box data show
- No sign of fabricated or stuffed results. Digit tests, turnout patterns and the turnout x vote-share test look like those of the 2022 election.
- Communities voted almost exactly as in 2022. Bloc shares by locality correlate at 0.99 between the two elections.
- The big change is Arab turnout, which rose from a median of 54% to 81% per ballot box, evenly across boxes and with no pile-up near 100%.
- Haredi boxes are stable, and double-envelope votes (soldiers and others) differ from regular votes in the same direction as in 2022.
- The outgoing coalition kept its voters and still lost its majority. It gained votes, but the electorate grew by 930,000 and most new voters went to the Arab parties and the Jewish opposition.
- Every religious community passes the same tests. Turnout rose in all Arab groups and among the Druze; the only stuffing-shaped boxes are seven, six of them in two small Bedouin villages, about 3,600 votes, worth checking against their protocols.
- Nine ballot boxes show transcription errors: about 1,350 votes appear under the wrong list's letters, usually the adjacent row of the protocol. Too few to change seats, and the kind of error the final count is meant to correct.
Summary
After the Brazilian presidential election I audited its public data. Israel voted on 27 October, and its Central Elections Committee publishes the result of every ballot box (kalpi). I ran the same kind of tests here and compared everything with the 2022 election.
The difference between the two countries matters. Brazil votes electronically, so a manual-fraud test says little about the software that produced the numbers. Israel votes on paper, counted by hand, and the tally of each box is written into a protocol. That is exactly the kind of process digit and turnout tests were designed for: they catch numbers written "from the head" and boxes filled with extra ballots. And when something looks wrong, the paper exists and can be recounted.
I am not a statistician. My background is physics and computer science, and I work in information security. I wrote and ran the analysis with the help of an AI model (Claude, by Anthropic), checking every result against the data. The scripts are open so that nobody has to trust me. Corrections and suggestions: eleicoes@lilianezukerman.com.
Data and scope
| File | Content | Coverage |
|---|---|---|
| Results by voting station, 2026 | Eligible voters, voters, invalid and valid votes, votes per list, for every ballot box | 12,018 regular boxes and 911 double-envelope boxes; final file of 4 November 2026 (earlier versions: 30/10/2026 13:54 and 2/11/2026) |
| Results by voting station, 2022 | Same format, 25th Knesset | Final official results |
The sums match the committee's national figures exactly: 5,717,397 voters, 25,971 invalid and 5,691,426 valid votes in 2026; 4,794,593 voters in 2022. Double-envelope boxes (soldiers, diplomats, prisoners, hospitals, polling staff) have no registered electorate, so they are left out of turnout tests and analysed separately.
This article was first written on the preliminary file of 30 October and recomputed twice: on the file of 2 November (8 boxes changed) and on the final file of 4 November, the one the committee submitted to the President. Between 2 and 4 November the committee corrected 78 boxes and added 3 double-envelope batches (699 voters): 55 of the corrections move votes between adjacent letters of the protocol with no change in the number of voters, 23 change a count by a few votes, and all together they move or add 1,789 votes out of 5.7 million. Every number below is from the final file. No seat changed between the three versions, and no test result moved beyond the second decimal place.
1. Digit tests
People who invent numbers leave marks. In a real count, the last digit of a box's total (the 7 in 187) is essentially random. Someone writing totals without counting tends to repeat some digits and avoid others. The second digit follows a known, gently decreasing pattern (Benford's law). Neither rule holds exactly for election counts, because boxes have similar sizes, so the reference used here is a simulation: each box's count is redrawn many times with ordinary sampling noise, keeping its real size and share, and the observed digits are compared with the simulated ones. The p-value is the chance of a gap that large by luck alone; below 0.05 counts as suspicious.
| Series | Last digit (p) | 2nd digit (p) |
|---|---|---|
| Voters per box | 0.28 | 0.76 |
| Likud | 0.46 | 0.30 |
| Yashar! | 0.07 | 0.40 |
| Beyachad | 0.47 | 0.73 |
| Joint List | 0.78 | 0.86 |
| Democrats | 0.41 | 0.06 |
| Yisrael Beiteinu | 0.85 | 0.68 |
| Ra'am | 0.14 | 0.09 |
| Otzma Yehudit | 0.16 | 0.14 |
| UTJ | 0.31 | 0.90 |
| Shas | 0.99 | 0.50 |
| Religious Zionism | 0.09 | 0.81 |
None of the 24 tests falls below 0.05 (chance alone would put about one there) and none below 0.01. The same tests on the 2022 election give 3 of 24 below 0.05. There is no sign of totals written without counting.
reproduce: forensics.py · sim_null.py
2. Turnout and ballot stuffing
Stuffing a box means adding ballots for people who did not vote. It leaves two marks at once: turnout rises toward 100%, and almost all extra votes go to one party. Plotting every box by turnout and by the winner's share, an honest election forms one cloud; stuffing adds a separate blob in the top-right corner. This is how the test exposed irregularities in Russia and Uganda.
No box has more voters than eligible voters, and every box adds up: list votes sum to valid votes, and valid plus invalid to voters. The highest turnout is 95%.
Turnout also shows no excess of boxes at round values. Invented protocols tend to land on 70%, 75% or 80%; here the number of boxes within 0.05 points of an integer percentage (1,186 between 50% and 99%) is within what the same simulation produces (1,151 on average, 95th percentile 1,217).
reproduce: forensics.py · sim_null.py
3. Comparison with 2022
Manipulation concentrated in some places would show up as places that suddenly vote unlike themselves. Lists changed between the two elections, so the comparison uses blocs. Correlation goes from 0 (no relation) to 1 (identical): 0.99 means that knowing a locality's 2022 vote almost exactly predicts its 2026 vote. Ballot boxes are compared where the same box number exists in both years (5,693 boxes); localities cover the rest.
| Bloc | Correlation by box | Correlation by locality | Average change |
|---|---|---|---|
| Arab parties | 0.992 | 0.996 | +0.7 points |
| Haredi parties (Shas + UTJ) | 0.983 | 0.969 | −3.0 points |
| Netanyahu coalition parties | 0.984 | 0.992 | −4.5 points |
| Likud | 0.957 | 0.964 | −1.8 points |
| Turnout | 0.784 | 0.506 | +8.3 points |
Votes barely moved within communities. What moved was turnout, and almost all of the largest changes are in Arab towns and Bedouin localities.
reproduce: compare_2022.py
4. The Arab turnout surge
Turnout in Umm al-Fahm went from 38% to 80%; in the Bedouin localities of Abu Gweid, Abu Rubei'a and Kabu'a, from between 24% and 42% to between 72% and 87%. A jump this large is exactly what a forensic analysis should examine closely.
Four things point to real mobilisation rather than manipulation:
• It was measured live. At 8 p.m. on election day the committee's figures already showed Umm al-Fahm at 70.1% (38.3% in 2022) and Rahat at 79.8% (60.6%), and Channel 12 estimated Arab turnout at about 80%, a record (Ynet, Al Jazeera). Arab turnout traditionally peaks in the last hours, which fits the higher final figure.
• The whole distribution moved. Even the 5% of Arab-majority boxes with the lowest turnout went from 35% to 66%. Stuffing affects some boxes and leaves them isolated near 100%; here the maximum is 95%, and only 20 of 1,449 boxes exceed 90%.
• The digits are normal. Last digits of Joint List and Ra'am votes in these boxes pass the test in both years.
• The register is normal. The electorate of the 117 Arab-majority localities grew 9.9% since 2022, against 7.7% in Jewish-majority localities, in line with population growth. The surge is in voters, not in registered names: 442 thousand voters in 2022, 727 thousand in 2026, on a register of 903 thousand.
Context matters too: turnout rose everywhere in 2026, from 65% to 71% in Jewish-majority localities and from 54% to 66% in mixed cities. The Arab rise is much larger, and it is a record for the sector, above the Jewish turnout for the first time in decades. Atypical is not the same as fabricated: the question is whether the extra 285 thousand votes carry the marks that fabricated votes leave, and they do not. The paper can settle what the numbers cannot: a hand recount of a sample of these boxes, and the voter lists marked at the table, would confirm the count directly.
Within each town, boxes with higher turnout gave a slightly larger share to Arab parties (correlation 0.18, up from 0.10 in 2022). That is weak, and it is what mobilisation produces: where parties brought more people out, they got more votes.
reproduce: arab_boxes.py
5. Haredi ballot boxes
Haredi boxes behaved almost exactly as in 2022: the same turnout, no association between turnout and Haredi share within a town (−0.09), normal digits for Shas and UTJ. The Haredi bloc's national share fell by 3 points because other groups, above all Arab voters, turned out in much larger numbers, not because Haredi voters stayed home.
reproduce: haredi_boxes.py
6. Double envelopes
Votes cast in double envelopes are counted separately, without a registered electorate per box, which makes them the least transparent part of the process and a frequent target of claims. There were 452,687 such votes in 2026 (7.9% of the total, in 911 batches) and 462,807 in 2022.
The file does not say who cast them. The committee opens the outer envelopes centrally, checks each voter against the register, then mixes the inner envelopes and counts them in batches of about 500. The 908 "boxes" of 2026 are those batches, not places or categories, so soldiers, prisoners, hospital patients and diplomats cannot be told apart; the committee publishes only how many envelopes came from each group. Before the election it expected 600 to 650 thousand double envelopes, because of reservists on duty and evacuees (Ynet); the count came in 2% below 2022.
Party digits in envelope boxes are normal in 2026. The totals per box are not tested: envelopes are packed in fixed batches (79 boxes hold exactly 500 envelopes in 2026, 119 hold exactly 600 in 2022), so round totals are expected. Invalid votes are slightly higher in envelopes in both years (0.58% against 0.44% in 2026), as is common for this kind of ballot.
reproduce: envelopes.py
7. Transcription errors
Boxes in the same polling site serve the same neighbourhood, so they should vote alike. The test looks for one specific pattern: a party that is strong in the rest of the site almost disappears in one box, while a similar number of votes appears under a list that has almost no votes there. That is the signature of a protocol copied into the system under the wrong letters. The total of the box does not change.
| Ballot box | Missing list (box / rest of site) | Votes appear under | Rows apart on the protocol | Votes |
|---|---|---|---|---|
| Qalansawe 15 | Joint List (0% / 79%) | "ה" Gan Eden (902 votes nationally) | 1 | 475 |
| Deir al-Asad 14 | Ra'am (0% / 44%) | "נף" (787 nationally) | 4 | 264 |
| Ein Mahil 6 | Ra'am (0% / 20%) | "נקי" (929 nationally) | 2 | 168 |
| Modi'in-Maccabim-Re'ut 86 | Beyachad (0% / 17.5%) | "רץ" HaKahal (1,011 nationally) | 1 | 122 |
| Arab al-Aramshe 1 | Joint List (0% / 31% in the village's other box) | "ה" Gan Eden | 1 | 105 |
| Netivot 6 | Otzma Yehudit (0% / 21%) | Democrats (18% in the box, 0.8% in the site) | 1 | 65 |
| Idan 1 | Beyachad (0%; the box gave 37% to Gantz in 2022) | "רץ" HaKahal | 1 | 56 |
| Kiryat Tivon 4 | Beyachad (0% / 15%) | "רץ" HaKahal | 1 | 50 |
| Tel Aviv 727.6 | Beyachad (0% / 10%) | "רץ" HaKahal | 1 | 46 |
Four checks support the reading of these nine boxes as transcription errors rather than real votes. The receiving list is a micro-list that gets 0 to 6 votes in almost every other box in the country (list "ה" gets more than half of its national total from Qalansawe 15 alone). The votes it receives match, within noise, what the missing list would have received given the rest of the site. Moving the votes back makes the box ordinary: its distance from the rest of the site drops from hundreds to the 6 to 20 range typical of any box. And in seven of the nine, the two lists sit on adjacent rows of the protocol in alphabetical order; the slip from Beyachad ("רק") to HaKahal ("רץ"), two visually similar letters on neighbouring rows, appears four times. Where the same box existed in 2022 (Modi'in, Netivot, Idan, Kiryat Tivon, Tel Aviv), its 2022 profile matches the rest of the site, not the 2026 numbers.
Two more boxes are inconsistent with their surroundings but do not fit this pattern: Ganei Tikva 33 (about 430 votes) has a Haredi profile in a secular suburb that had no such box in 2022, and no single row shift explains it; Jerusalem 623 gives 20% to the Joint List in a box that gave 83% to Religious Zionism in 2022. They may be data-entry mix-ups between boxes or genuine institutional boxes; the data cannot tell.
About 1,350 votes in the nine boxes, out of 5.7 million: far too few to change any seat. In the final 2022 file the same tests find only 2 small cases (48 and 21 votes), which suggests that the committee catches most of these errors before the official result.
Written on 30 October: if the review works, these boxes should be corrected in the final results published on 4 November. Rerunning same_site.py and fringe_check.py on the final file, or diff_results.py on the two files, will show whether they were.
The committee's file of 2 November differs from the 30 October file in 8 boxes. One of the nine boxes above, Idan 1, was corrected exactly as predicted: 56 votes moved from HaKahal back to Beyachad. The other eight are unchanged so far. The committee also fixed three slips that the tests here had not flagged, because the thresholds are deliberately conservative: Tirat Carmel 35 (73 votes from HaKahal to Beyachad; Beyachad has 13% in the rest of that site, under the 15% rule) and Nof HaGalil 951 (26 votes, the same slip), plus four letter mix-ups of 13 votes or fewer (Bnei Brak 99, Tel Aviv 402.3, Basma 11, Kfar Yehoshua 2) and one voter added in Bu'eina-Nujeidat 5. Four of the eight corrections are the HaKahal/Beyachad slip described above, which confirms the reading. Net effect nationally: 155 votes from HaKahal to Beyachad and one more voter; no seat changes.
With the rule relaxed to a 3% presence of the missing list in the rest of the site, the same pattern appears in two more small boxes, Akko 56.5 and Holon 243 (27 votes each), on top of the eight still pending. The final file will show whether they are corrected too.
The final file corrects every box flagged here, in the direction predicted: Qalansawe 15 (475 votes from "ה" to the Joint List), Deir al-Asad 14 (264 from "נף" to Ra'am), Ein Mahil 6 (168 from "נקי" to Ra'am), Modi'in 86 (122 from HaKahal to Beyachad), Arab al-Aramshe 1 (105 to the Joint List), Netivot 6 (65 from the Democrats to Otzma Yehudit), Kiryat Tivon 4 (50) and Tel Aviv 727.6 (46) from HaKahal to Beyachad, after Idan 1 on 2 November, and the two 3%-rule candidates Akko 56.5 (27) and Holon 243 (27). Rerun on the final file, same_site.py and fringe_check.py no longer flag any of them; the two boxes that did not fit the slip pattern, Ganei Tikva 33 and Jerusalem 623, are unchanged, as expected if they are genuine. The committee also corrected 67 further boxes that the thresholds here had not reached, almost all of them the same kind of slip between neighbouring letters (ד/ך/די, רץ/רק, זך/זץ, ה/ודם), of 1 to 27 votes each.
Two things follow. The transcription-error reading of section 7 was right in eleven of eleven cases, which is the kind of check an outside audit can only pass when the authority's own review is independent of it. And the official review catches slips well below the size that the tests here can see, which is consistent with the final 2022 file having only two small cases left.
Beyond these eight cases, many boxes differ strongly from their own site (about 490 in 2026 and 350 in 2022). Most sites mix neighbourhoods with different profiles, for example a Haredi box next to general-population boxes, so those differences are not evidence of anything by themselves.
reproduce: same_site.py · fringe_check.py · slip_check.py · diff_results.py
8. By religious community
The ballot-box files do not record anyone's religion, so communities are defined by where the box is. The Central Bureau of Statistics classifies every locality as Jewish, Arab, Bedouin tribe or mixed city, and gives its type (kibbutz, moshav, town). It does not split Arab localities by religion, so Druze, Christian-majority and Bedouin towns come from named lists. Groups that live inside larger localities (Haredi, religious-Zionist, and the Arab and Jewish neighbourhoods of mixed cities) are defined by the box's own vote. Each group then gets the same tests as the whole country.
| Community | Boxes 2026 | Turnout | Leading list 2026 | Last digit (p) | Boxes ≥90% turnout and ≥90% one list |
|---|---|---|---|---|---|
| Muslim Arab towns | 960 | 54% → 80% | Joint List 67.1% | 0.55 | 0 |
| Bedouin, Negev | 267 | 51% → 81% | Ra'am 86.7% | 0.11 | 7 |
| Bedouin, north | 48 | 51% → 79% | Ra'am 72.2% | n/a (few boxes) | 0 |
| Druze | 129 | 50% → 62% | Yashar! 37.9% | n/a (few boxes) | 0 |
| Christian-majority villages | 18 | 58% → 77% | Joint List 56.9% | n/a (few boxes) | 0 |
| Mixed-religion Arab towns | 112 | 52% → 73% | Joint List 50.9% | n/a (few boxes) | 0 |
| Mixed cities, Arab boxes | 178 | 46% → 63% | Joint List 61.1% | 0.12 | 0 |
| Mixed cities, Jewish boxes | 1,901 | 60% → 66% | Likud 21.5% | 0.41 | 0 |
| Haredi | 767 | 74% → 74% | UTJ 62.0% | 0.25 | 0 |
| Religious Zionist | 328 | 75% → 78% | Religious Zionism 47.0% | 0.41 | 0 |
| Kibbutzim | 305 | 70% → 74% | Yashar! 36.0% | 0.16 | 0 |
| Other Jewish boxes | 7,005 | 66% → 72% | Likud 28.8% | 0.53 | 0 |
Digit tests are normal in every group large enough to test. Vote shares inside each community barely moved; among the Druze, the Netanyahu coalition parties rose from 12% to 17%, with Yashar! leading.
The only boxes in the corner of the turnout x vote-share chart are in two small Bedouin villages in the Negev and one box in Rahat: Bir Hadaj (3 boxes, 92% to 95% turnout, 97% for Ra'am; 58% turnout in 2022) and Qasr al-Sir (3 boxes, about 93%, 98% for Ra'am; 75% in 2022). This is not evidence of stuffing: the committee's own figures at 8 p.m. already showed Bir Hadaj at 87.3%, small villages often vote as a bloc, and within Bedouin localities higher turnout goes with a slightly lower Ra'am share, the opposite of what stuffing would produce. But it is the one place in the data with the stuffing shape, about 3,600 votes in total, and the protocols of these six boxes are easy to check.
Among religious-Zionist boxes, the association between turnout and the religious-Zionist share within the same town rose from 0.11 to 0.30. It is weak, with no boxes in the corner, and most likely reflects mobilisation, but it is noted here for completeness.
reproduce: religious_groups.py · CBS list of localities (bycode2021.xlsx)
9. Where the 2022 voters went
The ballot is secret, so nobody knows how each person voted in both elections. But every locality has a different mix of 2022 voters: some had many Yesh Atid voters, others almost none. If Yashar! grows most exactly where Yesh Atid was strong, many Yesh Atid voters probably moved to it. The model looks for the transfer percentages (each 2022 group split across the 2026 lists and abstention, every row adding up to 100%) that best explain all localities at once. It is an estimate of average behaviour, known as ecological inference, so the numbers show the pattern, not exact flows.
The broad picture:
• Likud kept about 90% of its 2022 voters, with a small flow to Otzma Yehudit.
• Yashar! was built from National Unity (about 85% of Gantz's 2022 voters; Eisenkot was on that list) and part of Yesh Atid (about 44%). Beyachad took about 40% of Yesh Atid and most of the 2022 voters of smaller right-wing lists such as Jewish Home.
• Labor and Meretz voters moved to the Democrats (about 80%).
• Religious Zionism and Otzma Yehudit, a joint list in 2022, split roughly 60/24 when they ran separately.
• Arab parties kept practically all their 2022 voters and added 2022 non-voters: about 13% of everyone who did not vote in 2022, roughly 300,000 people (about 170,000 in the ballot-box model). This is the turnout surge of section 4, seen from the other side.
Some rows are fragile. The share of 2022 Yisrael Beiteinu voters who stayed home is 48% in the locality model and 28% in the ballot-box model, and Yesh Atid's split between Yashar! and Beyachad moves by about ten points between the two. The direction of every main flow is the same in both.
Where the outgoing coalition's majority went
The five parties of the outgoing coalition (Likud, Religious Zionism, Otzma Yehudit, Shas and UTJ) received more votes in 2026 than in 2022: 2.40 million against 2.31 million. They lost their majority because the electorate grew faster. Valid votes rose from 4.76 to 5.69 million, and the coalition's share fell from 48.4% to 42.1%.
The transfer model shows almost no crossing of the aisle: between 93% and 98% of the 2022 voters of each coalition party voted again for a coalition party, and the only visible exit was to abstention, roughly 110,000 to 220,000 voters depending on the model. Shas lost about a quarter of its votes, partly to abstention and partly to Likud and Otzma Yehudit. Of the roughly 930,000 additional voters, the model puts 170,000 to 310,000 with the Arab parties, 245,000 to 340,000 with Yashar!, Beyachad, the Democrats and Yisrael Beiteinu, and only 130,000 to 180,000 with the coalition parties.
In short, the coalition did not lose its voters; it failed to win the new ones. The direction of these flows is the same in both models, the amounts are estimates.
reproduce: transfer.py locality · transfer.py box
10. Seat arithmetic
The final count translates into these seats: Likud 27 · Yashar! 21 · Beyachad 12 · Joint List 11 · Democrats 8 · UTJ 7 · Otzma Yehudit 7 · Ra'am 7 · Yisrael Beiteinu 7 · Shas 7 · Rel. Zionism 6. Lists below the 3.25% threshold received 306,478 votes (5.4% of valid votes), which are not converted into seats.
What the arithmetic shows:
• The five parties of the outgoing coalition have 54 seats, 7 short of a majority. The four Jewish parties of the outgoing opposition have 48, and the two Arab parties 18.
• There are 221 minimal majorities (combinations of at least 61 seats in which every party is needed). 50 of them include no Arab party. All the four-party majorities include both Likud and Yashar!, the two largest lists.
• Without Likud and without the Arab parties, the smallest majority needs six parties.
• The Reservists missed the threshold by 29,772 votes. Had they passed, they would have taken about 3 seats, one each from Likud, Yashar! and Shas.
• Without the Arab turnout surge (Arab-majority ballot boxes at their 2022 turnout, about 263,000 fewer votes), the Arab parties would fall from 18 to 13 seats and the outgoing coalition parties would rise from 54 to 56, still short of 61. The seats would go mostly to the outgoing Jewish opposition. This is a simplified scenario: it removes votes in proportion to each box's result.
reproduce: more_findings.py
11. The map
Who came first in each locality, and where each bloc has an absolute majority. Likud is first in 299 localities (2.2 million valid votes between them): Rishon LeZion, Petah Tikva, Netanya, Ashdod, Beersheba, Holon, Ashkelon and most of the south and the periphery. Yashar! is first in 527 (1.46 million): Tel Aviv with 27%, Haifa, Ramat Gan, Herzliya, the coastal plain and most kibbutzim and moshavim. UTJ is first in Jerusalem (23%, Likud 17%), Bnei Brak (60%), Beit Shemesh, Modi'in Illit and Elad. The Joint List and Ra'am lead in 131 localities in the Galilee, the Triangle and the Bedouin Negev. Religious Zionism is first in 143 localities, almost all of them settlements, but with only 117 thousand votes.
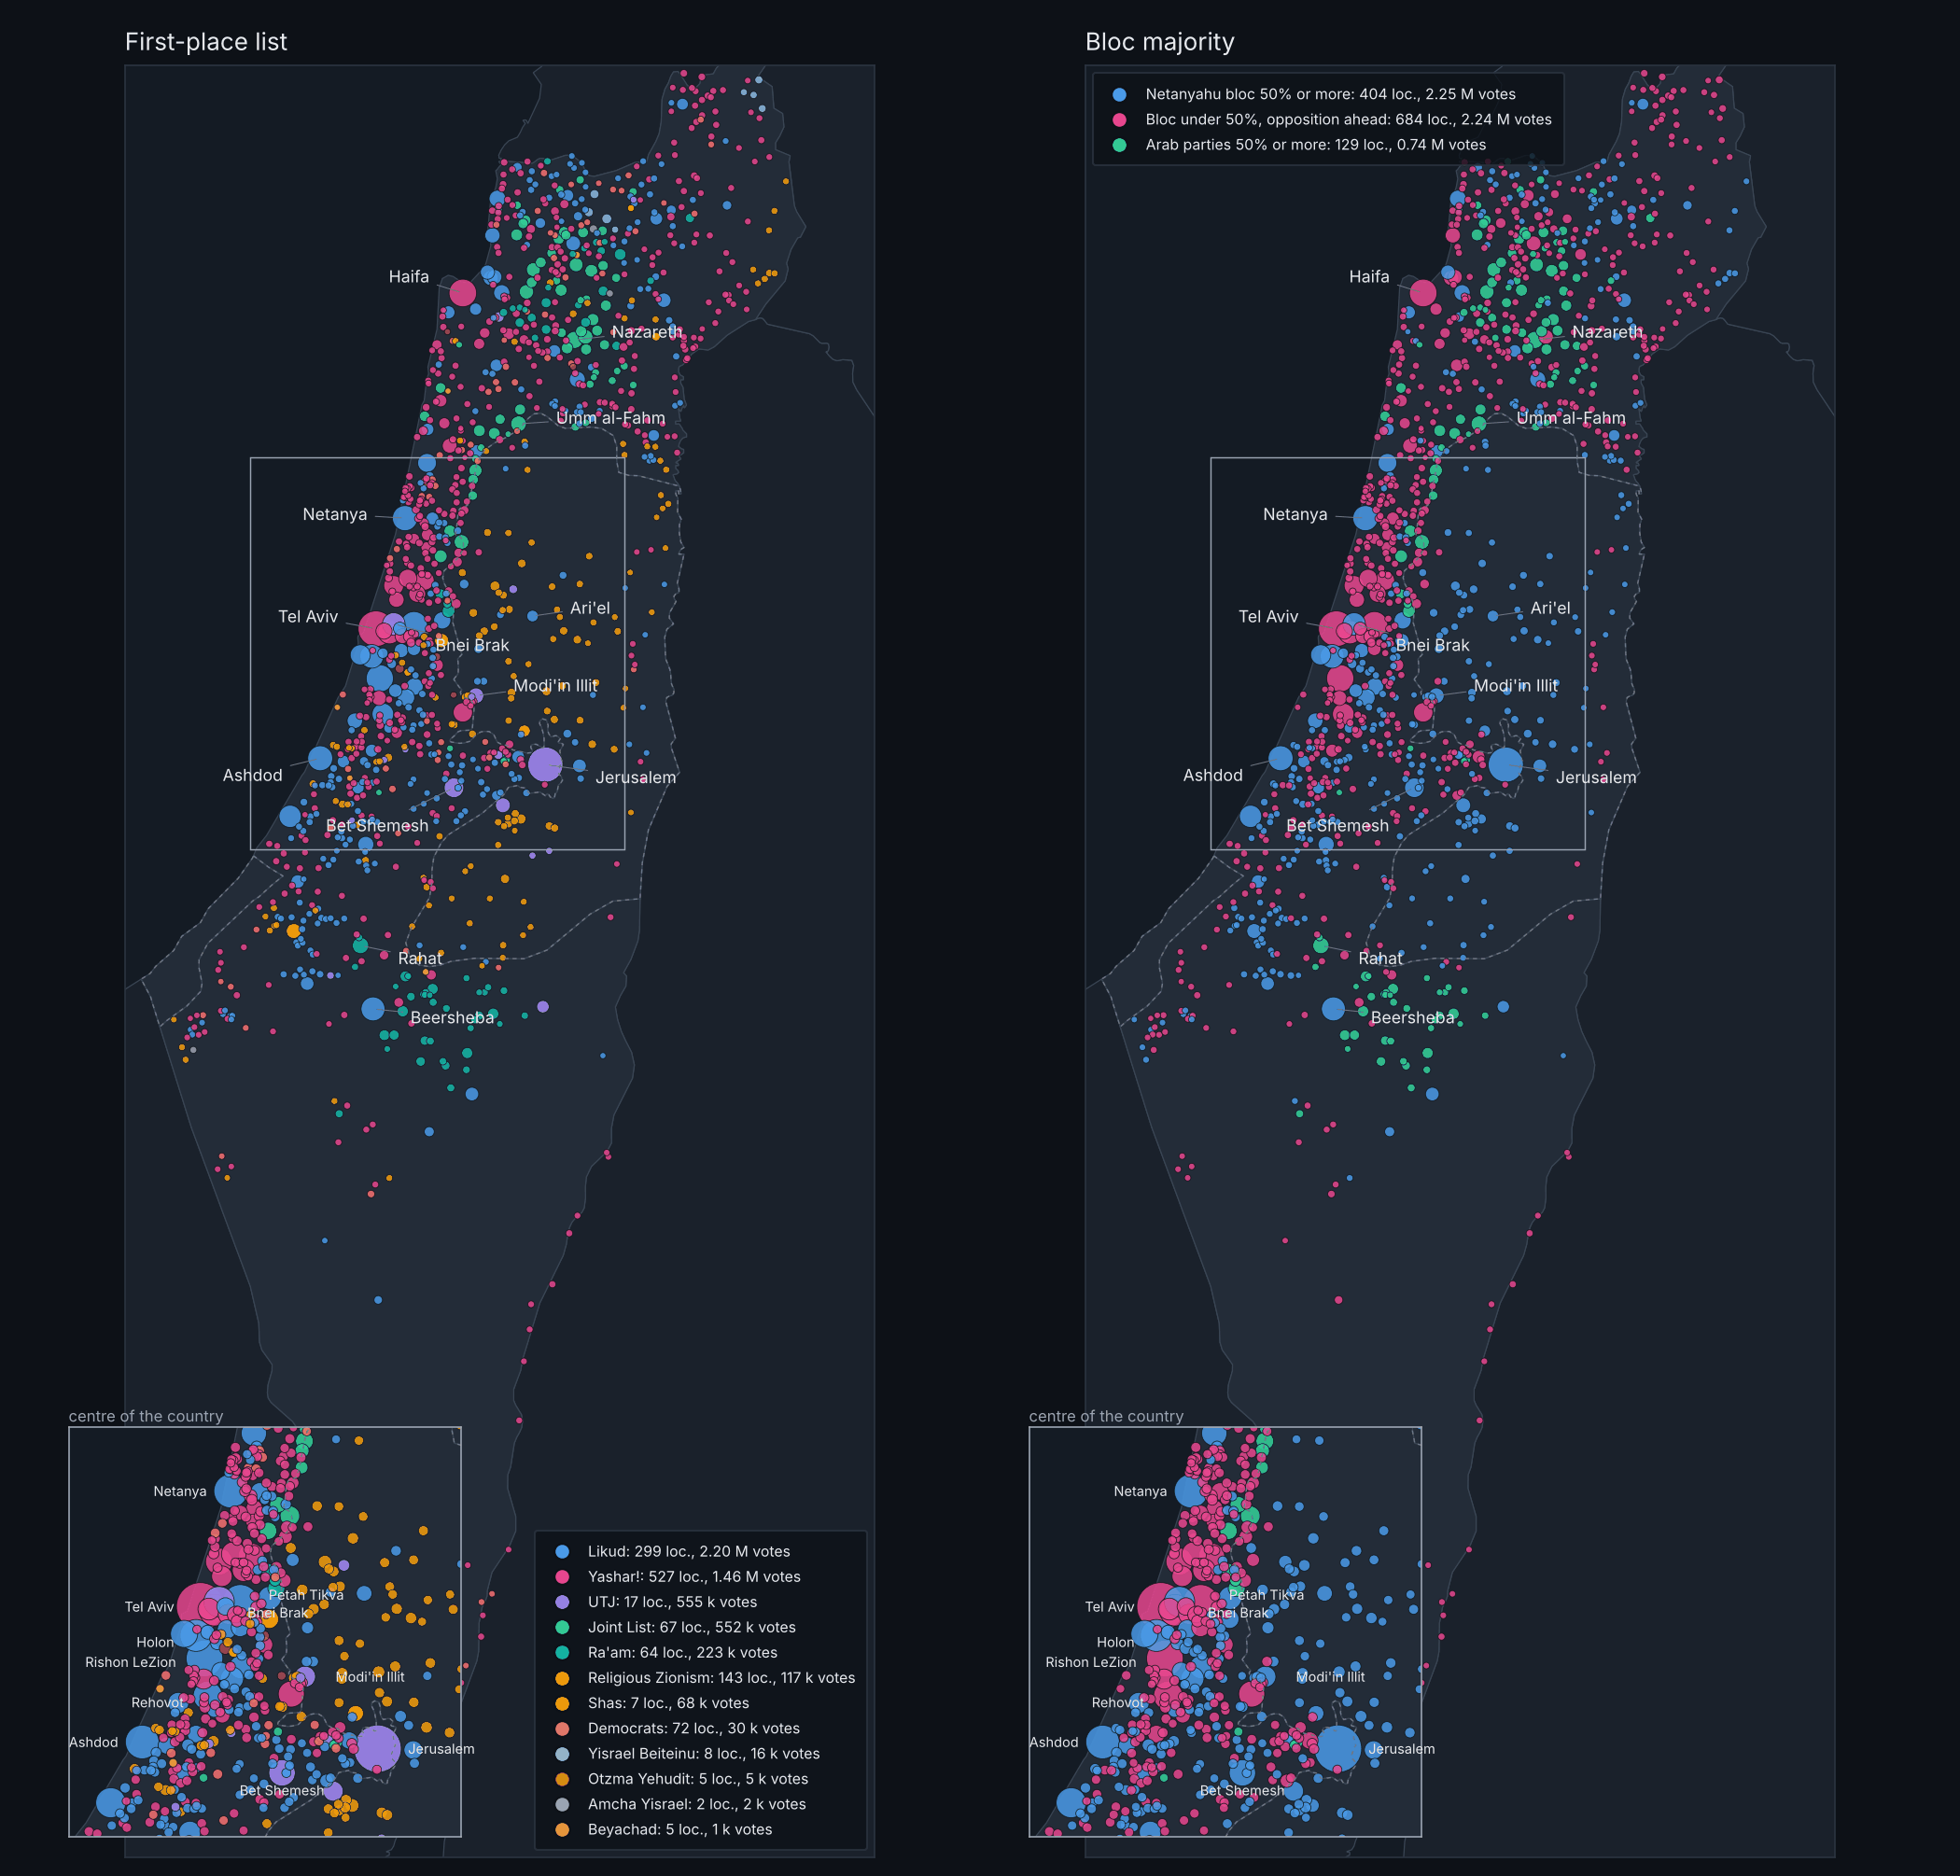
reproduce: map_localities.py
Limits
1. Three versions of the data. The 2026 results changed between 30 October, 2 November and the final file of 4 November; the changes are listed in section 7 and in diff_expb_2026-11-02_2026-11-04.txt. Nothing in the conclusions depended on which version was used.
2. What the tests catch. Digit and turnout tests catch fabricated totals and stuffed boxes. They do not catch votes moved between parties in amounts that look natural, invalidation of valid ballots, or pressure on voters. Those require the paper ballots and the protocols.
3. Group definitions. Arab-majority and Haredi-majority boxes are defined by their vote (70% or more for those parties). Religious communities in section 8 use the 2021 CBS list of localities and named lists for Druze, Christian-majority and Bedouin towns; localities founded later count as Jewish "other", and the Christian group has only four villages.
4. Ecological inference. The vote-transfer estimates in section 9 describe average behaviour across localities, not individual voters.
5. Box matching. Only part of the boxes keep the same number between elections; the locality comparison covers the rest.
6. Authorship. This analysis was not reviewed by a statistician. The methods are standard and referenced, but expert review may find problems I did not see.
Conclusion
The public ballot-box data of the 2026 Knesset election show no sign of fabricated totals or stuffed boxes. Communities voted as they did in 2022, and the largest change of the election, the surge in Arab turnout, is homogeneous, was measured live on election day, and carries none of the marks of manipulation. The errors the data do show are small transcription mistakes of the kind the final review is meant to fix.
The same mechanism decided both elections I audited this month. In Brazil, voters who had chosen a candidate in the first round stayed with their side, and the runoff was decided by those who had voted blank, spoiled their ballot or stayed home, most of whom came back for the incumbent. In Israel, 2022 voters stayed with their bloc, and the outcome was decided by people who had not voted in 2022, most of whom voted against the incumbent coalition. In neither country did the result come from voters changing their minds. It came from who showed up.
The other contrast with Brazil is the point of this exercise. Here, every number in this analysis can be checked against something physical: a paper ballot and a signed protocol. Statistical tests can only say that the numbers look natural; a paper record lets anyone go back and count. That is why I argue that every electronic voting system should keep one.
Reproduce
| Section | Script |
|---|---|
| 1–2. Digits, turnout, stuffing | forensics.py, sim_null.py |
| 3. Comparison with 2022 | compare_2022.py |
| 4. Arab ballot boxes | arab_boxes.py |
| 5. Haredi ballot boxes | haredi_boxes.py |
| 6. Double envelopes | envelopes.py |
| 7. Transcription errors | same_site.py, fringe_check.py, slip_check.py, diff_results.py |
| 8. Religious communities | religious_groups.py |
| 9. Vote transfer | transfer.py |
| 10. Seat arithmetic | more_findings.py |
| 11. The map | map_localities.py |
Data: "Results by voting station" files from the Central Elections Committee (votes26.bechirot.gov.il and votes25.bechirot.gov.il). Scripts: github.com/liliane-zukerman/israel-election-audit-2026.
References
Central Elections Committee for the 26th Knesset: results by voting station.
Klimek, P. et al. (2012). Statistical detection of systematic election irregularities. PNAS 109(41).
Kobak, D., Shpilkin, S. and Pshenichnikov, M. (2016). Integer percentages as electoral falsification fingerprints. Annals of Applied Statistics 10(1).
Deckert, J., Myagkov, M. and Ordeshook, P. (2011). Benford's Law and the detection of election fraud. Political Analysis 19(3).
Ynet: Arab voter turnout surges as parties projected to nearly double their seats
Al Jazeera: Israel election turnout hits 77.7%, highest since 1999